Pension fund performance: annual results 2021
1 April 2022
On March 10, 2022, De Nederlandsche Bank (DNB) published various key figures of 192 (2020: 203) pension funds or collective circles with regard to the fourth quarter of 2021. Based on the information for all four quarters, we provide an overview of developments in 2021.
Market share
At the end of 2021, the pension funds jointly had almost €1,600 billion in pension obligations (2020: almost €1,700 billion). The funds’ total investments at that time amounted to more than €1,800 billion (2020: approximately €1,700 billion).
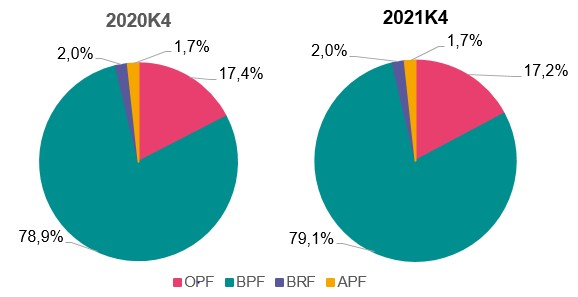
By far the largest part of the pension obligations (79.1%) lies with the industry pension funds. In 2021 there has been a small shift (0.2%) in the market share from company pension funds to industry pension funds. The market share of occupational pension funds and general pension funds, in terms of pension liabilities, remained stable. The figures below show the market share of the four types of pension funds at the end of 2020 (2020Q4) and at the end of 2021 (2021Q4).
Coverage degrees
The data that DNB publishes every quarter contains information about the policy funding ratios, but not about the current funding ratios. We have made an indicative overview of the current funding ratios using publicly available data.
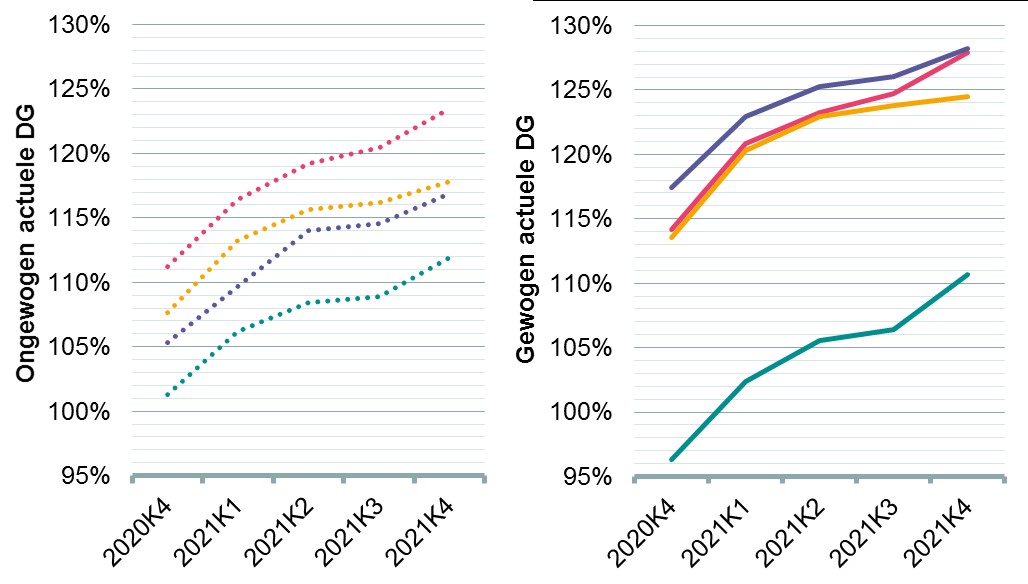
The average current funding ratios for the quarters 2020Q4 up to and including 2021Q4 are shown in the graphs above for each type of pension fund. The dotted lines (left) are the unweighted averages and the solid lines (right) are the weighted averages. The weighting is based on the invested capital, which means that more weight is given to the larger pension funds. The weighted average funding ratio across all funds increased in 2021, from 100.2% to 114.2%. The figures clearly show that BPFs have on average a considerably lower funding ratio than OPFs. The weighted funding ratios show that the large BPFs are lowering the average funding ratio, while the opposite is true for the other types of pension funds.
The same figures can also be made for the policy funding ratio (BDG):
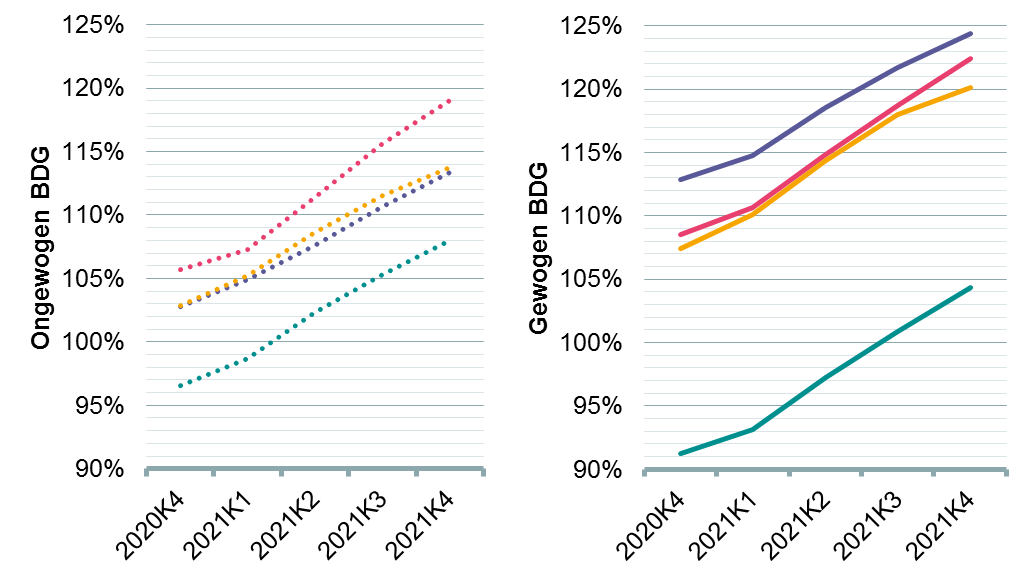
The unweighted BDG increased by 12.2% in 2021 from 102.9% to 115.1%. The larger pension funds showed a larger increase, as evidenced by the fact that the weighted BDG increased more (namely by 13.1 percentage points, from 95.0% to 108.1%).
Interest rate hedging and investment mix
The unweighted average interest rate hedge of the pension funds increased from 51.3% at the end of 2020 to 54.0% at the end of 2021. The weighted average interest rate hedge increased slightly more in 2021, from 39.0% to 44.9%. This means that larger pension funds started hedging more interest rate risk than smaller pension funds.
The unweighted average percentage of assets invested in real estate securities increased from 46.2% to 49.0%. Weighted, the percentage went from 52.3% to 57.2%. It can be concluded from this that larger pension funds on average take more risk than smaller pension funds, but also that the interest in commercial securities for the large funds has increased compared to a year ago.
Return 2021
The weighted average investment return in 2021 was 7.3% (unweighted 3.9%), which amounts to approximately €127 billion. In 2020, these percentages were still 8.0% and 10.2%. The investment return is depressed by approximately € 57 billion negative return from interest rate hedging (-3.3% of the average invested capital in 2021). In total, therefore, a return of approximately 10.6% was made on other components, with particular reference to returns on equities and real estate.
The data from DNB processed by us also provides a picture of the performance of the pension funds for the whole of 2021. We looked at a selection of 179 pension funds/collective circles for which the relevant information was available. The figure below shows the development of the current funding ratio compared to the investment return for the fund’s risk in 2021.
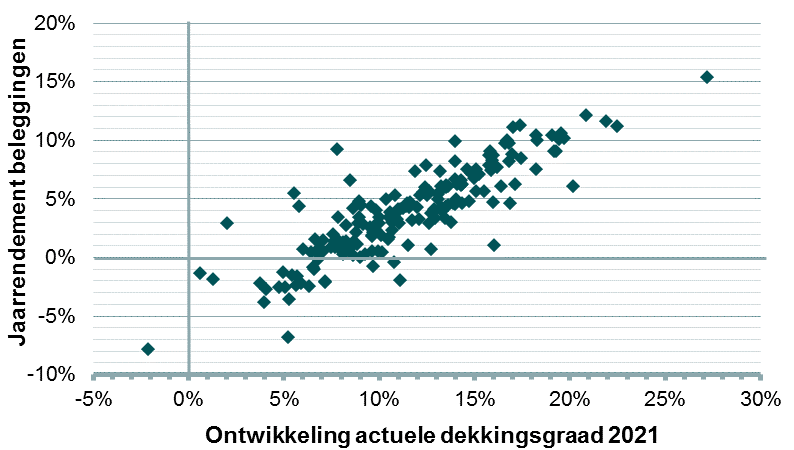
The figure shows that 155 of the 179 funds realized a positive investment return in 2021. As a result, the weighted average funding ratio increased by 14.0%. Of the 24 funds with a negative investment return, all but one fund showed an increase in the current funding ratio. The rise in market interest rates in 2021, resulting in a fall in the provision, will in most cases explain this.
The table below shows the average development in 2021 for the selected 179 pension funds, both unweighted and weighted on the basis of average invested capital.

The development of the weighted current funding ratio in 2021 is better than the unweighted development for all types of pension funds. This indicates that the funding ratio increased more for larger funds than for smaller funds. It is striking to see that the weighted return of the BPFs is 4.4 percentage points higher than the unweighted return. This indicates that the larger BPFs have generated more returns than the smaller ones. It can also be seen that the weighted investment return of BPFs is considerably higher than that of other types of pension funds, which can be explained, among other things, by the fact that the largest BPFs have hedged the interest rate risk less than average, which leads to a higher interest rate market in a rising interest rate market. higher investment return.
Performance of individual pension funds
We can use the data from DNB to estimate the annual returns of individual pension funds. It should be noted that the combination of the return rates over the four quarters in 2021 does not necessarily mean the annual return for 2021. Due to the strongly fluctuating quarterly returns in 2021, pension funds will be able to show slightly different returns when presenting the annual results.
Highest returns
The five pension funds with the highest investment returns are shown in the following table.

ABP finished in sixth place with an annual return of 11.1%. This percentage is a good explanation for the relatively high average return of the BPFs, and PFZW also raised the average with an annual return of 8.2%.
These five funds have a relatively low interest rate hedge (the market weighted average is approximately 45%). In addition, for four of the five funds, the percentage of marketable securities in the investment mix is above the market average (approximately 57%). This will also have contributed extra to the total return.
Lowest returns
The five pension funds with the lowest investment returns are shown in the following table.

Of these five pension funds, it is particularly striking that the interest rate cover is relatively high, whereby it should be noted that Kring Stability still had an interest rate cover of 80.6% in the first quarter of 2021. In addition, these funds have invested a relatively small part of their pension assets in commercial securities. We expect the combination of these two aspects to result in the lowest investment returns in 2021.


